The 10.10 release brings improvements throughout the library — from tile and vector rendering to sources, formats and interactions. The highlights are
Text support in the WebGL vector renderers, plus stale tile handling for WebGL tile layers
Smoother tile rendering: instead of clipping and redrawing full tiles, only the remainders of lower zoom levels are drawn
WMTS and OGC tile grids now honor the advertised tile matrix set limits, so no tiles are requested outside a layer’s data extent
GeoZarr gains selection of non-spatial dimensions, e.g. for time series
Text along lines honors offsetX and is split into graphemes, so ligatures are no longer cut apart
Fixes for the Modify interaction’s tracing, vector tile resolutions, decluttering z-index order, and text rendering of long lines
One upgrade note stands out: The BingMaps source is deprecated because Bing Maps for Enterprise retires in mid-2028. The recommended replacement is ol/source/ImageTile configured to point to the Azure Maps tile API.
A nice round-up of free (as in beer) base-map tile services you can use in your projects without authentication, signing up or creating authentication tokens.
maplibre-gl-shader-layer is a JavaScript library for creating custom tiled layers for MaplibreGL with WebGL and shader code. It simplifies WebGL development by leveraging ThreeJS under the hood and provides a framework for rendering complex data visualisations directly on maps with per-tile customisation. Its sweet spot is continuous data covering large geographic areas, where each pixel is a measurement rather than a colour. Think climate- and weather-related data, or remote sensing indices like NDVI.
It provides enough flexibility to create custom tile layer solutions, but already comes with powerful built-in layers. The most notable is the MultiChannelSeriesTiledLayer, which lets developers visualise multi-dimensional datasets. It uses RGBa raster tiles, but the values across the three channels don’t encode a specific colour; they represent multidimensional precision data, which the client then visualises.
It’s a neat library for those working in climate science and adjacent fields.
GeoViz is a new JavaScript library by Nicolas Lambert to produce maps on the web. It comes with a wide range of resizable markers and symbols, contour lines, geometry simplifications, map projections, layout marks (yeah, you can have that north arrow), and so much more. Built on D3, the syntax is similar and compatible, making it a flexible tool for serious thematic mapping on the Web.
The premise of TerraBit is simple: Click on any area around the globe and return similar locations. We’ve seen solutions to this problem before, NASA’s (currently broken) Similarity Search springs to mind. But TerraBit is different because the computation happens entirely in the browser using modern, cloud-native technologies.
The Clay v1.5 corpus is binarised, packaged as a partitioned GeoParquet and uploaded to a public object storage. The browser queries the data using DuckDB-WASM. The comparison of binary vectors then happens on the GPU.
The 50M embeddings are partitioned into geohash-aligned Parquet shards and published on Source Cooperative, which serves them cloud-natively out of S3 — public HTTP with byte-range support, no egress fees, no intermediate server. A single manifest file records the path, row count, and spatial extent of every shard.
When you draw an ROI, DuckDB-WASM queries the manifest with a bounding-box predicate — manifest-based shard pruning: the manifest acts as a coarse spatial index so the browser never opens metadata on shards outside the ROI. Once the intersecting shard list is resolved, DuckDB streams those shard files over HTTP (via httpfs range requests) and applies a second filter at the row level — a bbox predicate for rectangles, or ST_Intersects for freehand polygons — to extract only patches within the drawn region. Ranking over the candidate slice is exact brute-force Hamming: binary embeddings arrive as packed Uint8Array columns (128 bytes per 1024-dim vector) and are scored in a Web Worker via XOR+popcount, which maps directly to hardware-accelerated popcount instructions and completes in milliseconds for a typical AOI partition.
New results appear instantly, once the data is downloaded for the specified area of interest. Not long ago, this needed a round-trip to a back-end, now it runs entirely in your browser.
Cloud-native GIS platform GeoLibre has a new release out.
Qiusheng Wu, on LinkedIn:
What’s new in v1.9.0
CAD import: Add CAD drawings (DXF/DWG) as a layer, with a picker for choosing which drawing layers to load and a CRS selector for placing them correctly on the map.
Smarter service discovery: WMS and WFS panels now read the service’s GetCapabilities, so you pick available layers and feature types from a populated dropdown instead of typing names by hand.
Docked SQL Workspace: The SQL Workspace now docks as a resizable panel beside the map, with editor autocomplete for tables, columns, and SQL keywords.
Generic Vector to Vector conversion: Convert between any supported vector formats by file extension, alongside the existing targeted converters.
Richer camera tours: Per-keyframe hold and transition duration controls for finer pacing, plus save and reload of a named tour setup.
Better story maps: A hide-itinerary toggle, subtitle and byline fields on the printable handout, and dedicated start and closing slides.
Styling and plugin extras: A transparent (no fill / no outline) option in the color picker, a Legend populated from a paletted raster’s color table, and plugins can now use the maplibre-gl-raster stack and the projection control.
GeoServer 3 set out to modernise the platform from the foundation up, and that is what this release delivers. The work was a coordinated programme rather than a single change, where a handful of major upgrades each set off a chain of smaller, necessary changes across the codebase. The items below are the headline changes that triggered much of the surrounding effort.
A modern Java foundation. The GeoServer ecosystem now runs on JDK 17 and Spring 7, the central upgrade that drove the rest of the work and brings GeoServer back onto a current, supported stack. That move cascaded into Jakarta, modern servlet containers, and a wide set of supporting libraries that all had to be carried forward together. The project worked through the dependency tree end to end, so the platform sits on a clean, maintainable base.
Modern raster processing. ImageN has replaced the legacy image-processing engine, putting raster processing on a modern foundation that is far easier to maintain going forward.
Reinforced security. Security and vulnerability management have been strengthened throughout, putting GeoServer on a stronger footing for the kinds of compliance and assurance its users increasingly need.
A refreshed administration experience and documentation. The administration interface has been rebuilt with a new context-driven design, and the documentation has been refreshed and updated alongside it.
Geoserver has been around forever, its one of these open-source projects that often fly under the radar. Rarely do you see flashy demos that work well on social media. But it’s nevertheless a core part of the geospatial open-source ecosystem and used in countless places. The variety of organisations that funded this work proves it.
The first alpha release of the forthcoming major version of LeafletJS is out.
This release marks a major modernization of the Leaflet codebase. We’ve dropped support for Internet Explorer, removed legacy methods and polyfills, adopted modern standards like Pointer Events, and now publish Leaflet as an ESM module. The global L is no longer part of the core package (though it’s still available in the bundled version leaflet-global.js for backward compatibility).
While the release doesn’t include any significant new features (not that there’s anything wrong with that), some breaking changes will be relevant to the majority of Leaflet developers:
The removal of factory methods; instead of L.Map("map"), you will directly import and instantiate the Map class with new Map("map").
Mouse and touch events have been replaced with Pointer events, making it easier to build web maps for devices with varying input methods.
Leaflet is now published as an ESM module, you can now import Leaflet components with import { Map } from "leaflet";.
There’s no timeline for the final release yet. Currently, the version milestone only has one open ticket, so this is a good time to upgrade your apps and plugins. There is the Leaflet V1 Polyfill for those who want to upgrade to Leaflet 2 but don’t want to fix breaking changes in their applications.
The SparkGeo team has tested Lovable and asked it to create a simple interactive map showing Canadian cities and their population.
results weren’t always consistent. Running the same prompt twice sometimes yielded drastically different outcomes: one time clean and functional, the next time oddly styled or partially broken. In one case, even after explicitly stating not to use any frameworks, Lovable still generated a React-based implementation. A quick follow-up prompt corrected this, and to its credit, the revised output was clean, readable vanilla JavaScript.
That responsiveness is promising, but also highlights an important caveat: some knowledge of development (especially in geospatial UI) is still necessary. Without it, spotting issues or debugging quirks could become a frustrating barrier. Lovable gets you 80% of the way there, but that final 20% – the part where accuracy, accessibility, and usability matter most, still depends on human expertise.
Even for simple applications, you need a knowledgeable engineer to create a finished product. This is fine if you treat generative AI assistants as a tool, not the solution.
But an important question lingers. While engineers rely more and more on generative AI to build applications, they spend less time understanding the concepts and libraries they’re working with, making mistakes and gaining experience allowing them to understand and improve the code they write. By extension, engineers never learn enough about the technology they’re putting to work, maybe even unlearn some of the things they know now. If that turns out to be the case, who will maintain applications largely built with AI in the future?
react-google-maps is a library containing React components and hooks for building Google Maps user interfaces. It includes components to render maps, customisable markers, info windows and control panels. The hooks allow developers to access underlying object instances, such as the Map object, or to load additional APIs, like the geocoding or direction services. If you work in React and use the Google Maps JavaScript API, this library will save you a couple lines.
Python library Lonboard promises super fast visualisation of huge geospatial datasets in Jupyter notebooks. The demo renders over three million data points in under three seconds; a load that brings other libraries to their knees.
We’re sharing lonboard, a new python library, to fill this need. On a dataset with 3 million points, ipyleaflet crashed after 3.5 minutes, pydeck crashed after 2.5 minutes, but lonboard successfully rendered in 2.5 seconds.
Impressive speed, all without clustering or downscaling the data. Lonboard renderes exactly the amount of features that it finds in the data set. How is this possible you ask? Lonboard employs efficient binary data encodings, as opposed to more traditional text-based formats like GeoJSON:
Lonboard is so fast because it moves data from Python to JavaScript (in your browser) and then from JavaScript to your Graphics Processing Unit (GPU) more efficiently than ever before. Other Python libraries for interactive maps encode data as GeoJSON to copy from Python to the browser. GeoJSON is extremely slow to read and write, resulting in a very large data file that must be copied to the browser.
With lonboard, the entire pipeline is binary. In Python, GeoPandas to GeoArrow to GeoParquet avoids a text encoding like GeoJSON, resulting in a compressed binary buffer that can be efficiently copied to the browser. In JavaScript, GeoParquet to GeoArrow offers efficient decoding (in WebAssembly). Then deck.gl can interpret the raw binary buffers of the GeoArrow table directly without any parsing (thanks to @geoarrow/deck.gl-layers).
The 8.0 release brings several API simplifications. Some of them are not backwards compatible, so make sure to read the upgrade notes. The new StadiaMaps source replaces the Stamen source, because Stamen no longer hosts map tiles. Several WebGL improvements are also part of this release. And finally, a new loader API for image layers makes working with non-tiled raster data more modular and faster.
My colleagues at Development Seed have released eoAPI:
Say hello 👋 to eoAPI, a cloud-native backend for standing up a modern, open geospatial data infrastructure. Built around the STAC specification, eoAPI makes massive earth observation (EO) data archives discoverable and interoperable. EO data is accessible through open community standards for data discovery, allowing your data to connect seamlessly to scientific notebooks, AI pipelines, and dashboard interfaces.
eoAPI bundles open-source software into a package, which simplifies standing up modern geospatial data infrastructure to aid discovery and visualisation of geospatial vector and raster data and make it available through open standards:
pg-STAC is an optimized Postgres schema to index and search large-scale STAC collections.
stac-fastapi is an Open Geospatial Consortium (OGC) Features API compliant FastAPI application for STAC metadata search.
titiler-pgSTAC is a TiTiler extension that connects to pgSTAC to support large-scale dynamic mosaic tiling for visualizing STAC collections and items.
tipg is an Open Geospatial Consortium (OGC) Features and Tiles API for vector datasets.
Getting started is easy with infrastructure-as-code templates allowing you to deploy eoAPI with opinionated but reasonable defaults:
eoapi-cdk - A set of AWS CDK constructs to deploy eoAPI services.
eoapi-template - An AWS CDK app that shows how to configure the eoapi-cdk constructs.
eoapi-k8s - IaC and Helm charts for deploying eoAPI services on AWS and GCP.
The softwares is available open-source and free under the permissive MIT licence.
Mapbox GL marked a paradigm shift in web mapping; away from pre-rendered tiled raster maps towards more dynamic vector maps rendered in the client.
Konstantin Käfer looks back at the early days of Mapbox GL:
Luckily, the time was right for a new approach. Several things fell into place that enabled the creation of Mapbox GL:
We had just developed the Mapbox Vector Tile format, enabling efficient delivery of small chunks of geodata to the client. Over the past decade, this format has become tremendously successful and is now an industry standard that is used across the entire geospatial community.
WebGL was becoming widely available, having been standardized just two years earlier.
Mapbox GL was a game-changer. Too bad they decided to switch to a proprietary license.
This has been lurking in my feed reader for a while, but it’s still worth sharing: Google offers a new set of Web Components to compose and add basic maps applications to websites, removing the need to write extensive JavaScript.
The basic example shows how to add a map with a marker to a website:
More interactive maps can be built with auxiliary components for buttons, layout and overlays.
This is a positive development: Web Components allow developers to add basic map functionality to websites without resorting to additional frameworks with potentially heavy footprints. I’d like to see more proposals like this.
Open-source alternatives are available (for OpenLayers) or have not seen significant development in recent years (for Leaflet).
Initially we turned to Mapbox, an established leader for generating and publishing online maps. But when we embedded a map from Mapbox on our staging website, we found it assigned a tracker that could not be disabled without violating Mapbox’s terms of service.
They ultimately settled for MapTiler in combination with MapLibre. Go open source!
A new major release is available of the open-source WebGL mapping framework MapLibre GL.
This release is a big step for MapLibre GL JS! With more than 500 commits, and almost a year in the making, version 3.0.0 is surely our best release yet.
Notable changes include:
The release completes the transition to WebGL2, bringing better interoperability with other WebGL2-based frameworks and better performance through parallelisation,
transformCameraUpdate provides a hook that allows you to manipulate the map’s camera state, ideal for use with reactive front-end frameworks where the camera-state properties are stored externally,
Better, continuous interpolations when using HCL interpolations via interpolate-hcl,
Several improvements to stabilise 3D terrain display.
Several performance improvements make MapLibre generally faster.
VersaTiles is a set of open-source applications that form a complete stack to create, host, and visualise OpenStreetMap data on the Web using vector tiles.
From the VersaTiles website:
VersaTiles lets you use OpenStreetMap based vector tiles, without any restrictions, locked-in paid services or attribution requirements beyond OpenStreetMap. You can use the freely downloadable tilesets from VersaTiles on your own infrastrure, in any way you like. Our open spec, royalty free and permissively licensed conatainer format works with virtually any webserver or CDN — with no requirement to pay unreasonable prices for “Tiles-as-a-Service”.
It includes a tile generator, based on TileMaker that produces tiles in the Shortbread schema. A converter produces tiles in the custom *.versatiles format from MBTiles. The VersaTiles format results on a smaller footprint—compared to MBTiles—and it doesn’t use SQLite under the hood. That means you can host it pretty much anywhere, either using the VersaTiles server or on a CDN; and clients can utilise HTTP range requests to access a subset of the data. The front-end is based on MapLibre, and includes map styles and a range of open-source fonts.
OGC Web Map Service (WMS) layers (Yes, they still exist),
A terrain extension allows developers to render 2D data on a 3D surface, and
Collision filters, hiding overlapping features and resulting in cleaner visualisation of dense data.
Deck.gl doesn’t get much recognition, but it looks like a serious web-mapping toolkit.
The market for open-source web-map libraries is getting crowded again. Some classic libraries are still around: OpenLayers, Leaflet, and MapboxGL (technically not open-source). With MapLibre, Gleo, and Deck.gl, some promising new implementations are on the rise. Technology-wise, map front-ends have stalled in the last couple of years. I hope this newfound competition results in advancements in the field.
Planet has published a library of React components to build map user interfaces using OpenLayers:
The @planet/maps library provides components for rendering maps in your React applications. The library acts as a wrapper around OpenLayers, transforming the imperative API into declarative components.
The purpose of this project is to provide a mapping between React’s declarative components and OpenLayers’ imperative API. In other words, this project provides a React renderer for OpenLayers.
[…]
Components exported by this package map 1:1 with classes exported by OpenLayers.
Component props map directly to properties that are settable on instances of OpenLayers classes. Exceptions to this are props like options (passed to the constructor only), listener props (e.g. onChange), and ref.
Components accept a ref that provide access to the underlying OpenLayers instance.
The examples only show a small fraction of the whole feature set of the library. I looked through the source code on GitHub, and it seems like many—if not all—OpenLayers classes have a corresponding React component in the library.
James Milner released an alpha version of Terra Draw, a JavaScript library that implements adapters centralising drawing functions across different map libraries. Instead of building functionality to draw rectangles, lines, or points for each mapping API, you can now learn Terra Draw and be done with it.
Leaflet, MapboxGL and Google Maps are supported; of the major contemporary libraries, only OpenLayers and MapLibre are currently missing. Terra Draw supports creating and editing points, lines, polygons, and circles and even includes a freehand tool.
Most products are set on one mapping library, and Terra Draw will be less valuable. But there are a couple of scenarios where Terra Draw is useful. Terra Draw could be an option if you’re building a new product and haven’t decided (or don’t want to commit) to one mapping library or base map provider. It allows you to focus on the problem, not the technology. In consulting, when different projects often require a different provider, Terra Draw allows transferring solutions across various projects, potentially freeing up time to work on other things. And TerraDraw enables you to adhere to engineering best practices: The drawing implementation is abstracted away so you can switch libraries later; for example, when a vendor decides to change to a more restrictive proprietary license.
Iván Sánchez Ortega introduces Gleo, a WebGL mapping library he’s been working on for a couple of months now:
What’s Gleo? In a nutshell, it’s a Javascript, WebGL-first, web mapping display library. It’s kinda reinventing the wheel of Leaflet/Openlayers/MapLibre, if such reinvention involved a lot of OOP architectural thinking.
Why you ask, if we already have OpenLayers and MapLibre doing pretty much the same thing:
The point is being able to understand the architecture of a WebGL map library. Because, as I said several times during the conference [FOSS4G], I still don’t understand what a “bucket” is in Maplibre parlance.
Building something for the sake of understanding the fundamentals of some technology is a perfectly fine reason to reinvent the wheel.
You can view the code on GitLab or follow Iván on Mastodon or Twitter, where he posts regular updates about his work on Gleo.
A design proposal for the modularization of the map rendering architecture can be found at #547. This modularization will allow new rendering architectures to be implemented quickly and more easily, and we anticipate that the modularization will give us a concrete framework to better interrogate various migration strategies.
I love this approach, gathering feedback from the community before starting the work to make actual changes to the code and architecture.
Polylines are an efficient way to represent line geometries. You provide a geometry, and out comes a scrambled string of letters and numbers that encodes the geometry in just a few characters. Polylines are helpful when you want to efficiently transfer geometry information between services. The Mapbox Static Images API, for example, can overlay complex geometries from Polylines, which wouldn’t be possible otherwise because the request-URL length is limited.
Placemark has released a new Polyline JavaScript library, allowing developers to encode or decode coordinate arrays and GeoJSON objects. It does pretty much the same as existing Polyline utilities from Mapbox or Google. Still, Placemark’s solution is a modernised implementation that includes TypeScript types and a neat autogenerated documentation site; it supports ESM and UMD imports and standardises longitude-latitude order.
Leaflet was one of these libraries that I thought were done. While there have been constant updates and new releases throughout the years, there were rarely any massive, ground-breaking additions. Leaflet is built perfectly against its small, well-defined scope. Huge changes just weren’t necessary.
Even great software is never done because it needs to keep up with the latest technological developments. And so development of a new major release for Leaflet was announced as part of the 1.9 release notes. The work for the next major version catches up with recent developments in the browser market, the JavaScript landscape and compiler tooling:
Dropping support for Internet Explorer.
This has been a long time coming, but now that Internet Explorer is officially end-of-life, it’s time to say goodbye. Going forward, Leaflet will move to an evergreen strategy that targets browsers like Firefox, Chrome, Edge and Safari.
Embracing modern JavaScript.
To maintain backwards compatibility, Leaflet is written entirely in ES5, a version of JavaScript supported by legacy browsers. So we have not been able to make use of many great JavaScript features (e.g. standardized classes, instead having to rely on our own implementation). By adopting a more modern version of the ECMAScript standard, we can start working towards aligning Leaflet with what is expected from a modern JavaScript library.
Standardized modules.
When we released Leaflet v1, the landscape in the JavaScript world was very different and full of competing module standards such as CommonJS, AMD and UMD. Today, ECMAScript modules have become the clear way forward to unite the JavaScript ecosystem under one banner. Moving forward, Leaflet will only be distributed in a single standardized module system, greatly reducing complexity of our distributed code.
Removing the Leaflet global.
As a developer using Leaflet, the capital letter L is probably intimately familiar to you. This is the Leaflet global where all of Leaflet’s functionality lives. To allow compiler tooling to better eliminate dead-code through a process called tree-shaking, we are removing this global variable. To preserve backwards compatibility with older plugins, we will provide a shim that can be imported manually that will restore this functionality.
There’s no release date, not even an estimate, and maintenance of the 1.x branch will continue in the meantime.
Felt have hired Erica Fischer and are reviving development of Tippecanoe, which hasn’t seen many updates in the last couple of years. The last release was on over two years ago.
Tippecanoe is an essential tool for geospatial-data providers. It creates vector tile sets from various geospatial formats and optimises the data for visualisation purposes, so the resulting maps allow viewers to understand the density of a data set without clustering or excluding data.
Speaking in the Felt blog, Erica hints at what might be next in store for Tippecanoe:
The special challenge of Tippecanoe at Felt is that it is being applied to user uploads with no opportunity for manual configuration, so it has to be able to make efficient, faithful, good-looking tiles without being given any hints about what kind of data it is tiling. I already know that it doesn’t currently do very well at low zoom levels with topographic contours, or with gridded data represented as individual polygons, or with continuous urban parcel polygons, or with branching systems of rivers, and I’m sure the uploads will also soon reveal other usage patterns that need to be detected and given some special treatment.
Felt will maintain Tippecanoe in a fork; Brandon Liu, of Protomaps fame, has also been working on another fork — and they are planning to unify development going forward.
Initial OGC API support has been added, allowing to expose layers specified in the Mapfile to be exposed as collections and the layer’s features as items.
MapServer, together with PostGIS, was one of the first open-source GIS libraries I used as a Geography student some 20 years ago. If my memory isn’t too clouded, MapServer was among the first open-source products to implement OGC standards. Fantastic news that it’s still under active development and keeping up with the latest developments in the industry.
Just in time for FOSS4G next week and the annual OpenLayers Feature Frenzy, the OpenLayers team has released 7.0.0, a new major version. Over 90 pull requests went into this release, but two changes stand out: Internet Explorer is no longer supported. And WebGL rendering has been extended to support lines and polygons alongside points.
A renderer converts geo-data into data structures that browsers can render. In the past, OpenLayers has primarily relied on the Canvas API to render vector data. Compared to Canvas, WebGL is considered more performant, especially when visualising complex geometries or large datasets.
Adding more WebGL-rendering capabilities to OpenLayers has been an ongoing effort in the last few years, and there’s more to come:
The rendering API is still low level and experimental. Future releases will include a higher level styling API.
Technically this is a breaking change, but upgrading should be straightforward, according to the release notes:
[W]e changed the signature for a number of methods on a helper class that had been marked as part of the API in 6.x releases. While this is technically a breaking change, it is unlikely that applications were using this helper class, so upgrades should be straightforward.
I somehow missed this: Bertin.js has reached a significant milestone with its 1.0 release.
A world map produced with Bertin.js. Screenshot from @neocartocnrs.
Bertin.js is a JavaScript library that simplifies creating static thematic maps in SVG, primarily for print, online publications or presentations. You can certainly add a level of interactivity, but Bertin.js isn’t designed to replace, or compete with, interactive-mapping libraries like Leaflet, OpenLayers, or MaplibreGL.
Bertin.js provides a comprehensive API to make thematic maps using classification, cartograms and tooling to add map components, such as titles, footers, legends, or graticules. It is a wrapper around D3’s powerful mapping capabilities, providing reasonable defaults so you can focus on designing your map and don’t have sweat intricate details such as creating a legend and specifying individual pixel coordinates to perfectly align symbols and labels.
Following last week’s post explaining the tile-addressing schema in PMTiles version 3, Brandon Liu now discusses its compression approach reducing the disk space required to store a global tile dataset to only 91.6 MB.
Update: Brandon clarified on Twitter, the 91.6 MB mentioned above only holds the data required to map Z,X,Y coordinates to the corresponding Tile ID. The actual global map data set is 80GB. (15 August 2022)
A new version of MapLibre was released just yesterday. Release 2.2.0 is a minor version in semantic-versioning speak, but it adds a major feature: 3D terrain maps, enabling developers to visualise the topography of land surfaces in interactive maps on the Web.
Mapbox introduced a similar feature to Mapbox GL 2.0.0, the first of the library’s releases after moving away from an open-source license. MapLibre is a fork of Mapbox GL that was created to preserve and continue the work under an open-source license. Thanks to the efforts of MapLibre maintainers, developers can now build interactive 3D maps for the Web using open-source technology.
I’ve played around with a small example based on an example by Oliver Wipfli, and the results look really slick. Some minor issues still exist, for example, the hill shade disappearing when you tilt the map close to a horizontal view.
MapLibre's 3D terrain in action; also demonstrating smaller issues when tilting the map close to a horizontal view.
It’s great to see the project under such active development. Mapbox has paved the way for modern web mapping with vector tiles, but it’s good to have more competition in the space — even better when the competition is open-source.
Django 4.1 brings two new features for handling geographic geometries; allowing developers to create valid and canonical geometries more easily:
GEOSGeometry.make_valid() returns a valid representation of a geometry. Unless the geometry is already valid, then the geometry is returned without changes. The function is very similar to ST_MakeValid in PostGIS.
GEOSGeometry.normalize() returns the canonical, or standardised, representation of a geometry. The method now accepts the optional clone keyword indicating that the normalisation must not change the geometry and instead return a new geometry object.
Additionally, support for GDAL 2.1 and PostGIS 2.4 has been removed, and the Django Admin’s OpenLayersWidget is now deprecated.
Check the release notes for all other changes in Django 4.1.
Whether you’re just beginning with Leaflet or you’ve been around when Leaflet 0.7 was the current release, this collection of more than sixty Leaflet examples is a valuable resource for anyone. There are basic examples like setting up a Leaflet map or adding a marker, solutions to more complex problems like fitting bounds with padding, and advanced concepts such as overlaying images or searching across layers.
A new release of the web-mapping library OpenLayers is out. v6.15 includes, among other things, performance improvements, enhanced styling options for symbols, and bug fixes.
mbtiles-s3-server is a new Python library, developed by Michal Charemza, which reads vector geo-data from an MBTiles file stored in S3 and serves it as vector tiles. The library leverages range requests to query an SQLite database in S3.
Very much in line with advancements in file-based, cloud-optimised data storage we’ve been seeing in the last couple of years.
The Google Maps API was never an obvious choice for building advanced cartographic data products. It was always something local businesses use to put a map on their website showing where their shops are located.
Google Maps has now introduced data-driven styling, addressing a new audience outside local businesses. Data-driven styling of Google-maintained administrative boundaries that is. Google maintains and provides a data set of boundaries at varying administrative levels and allows developers to join their thematic data to create choropleth maps.
Looking at the documentation, linking your own data to Google’s boundaries dataset isn’t straightforward. To match the records from your dataset to the features from Google’s boundary dataset, you need to find the corresponding place ID from the Region Lookup API. If you have a hundred records, you need to do a hundred location lookups via the API before your map can be fully rendered. Unless you’re already keeping Google’s place ID in your data, which we all do, don’t we?
What’s the point of this approach is over loading and styling a GeoJSON layer, which has been supported by the Google Maps API before? Sure, you don’t have to maintain an administrative-boundaries dataset. But if the geometry and thematic data come from different sources, can we be sure that both represent the same underlying geographic area. Does this number of Covid cases aggregated by council assume precisely the same boundaries Google provides? We can’t know for sure, and the resulting maps might be unintentional lies.
And obvious use cases for maps based on administrative boundaries include election data, demographic information, or the number of COVID cases within a council. The people producing such data sets will likely maintain or have access to official and accurate boundary data sets. They have no reason to use Google Maps.
Google Maps data-driven styling isn’t a well-designed API of a product that solves a real problem. It’s a marketing stunt.
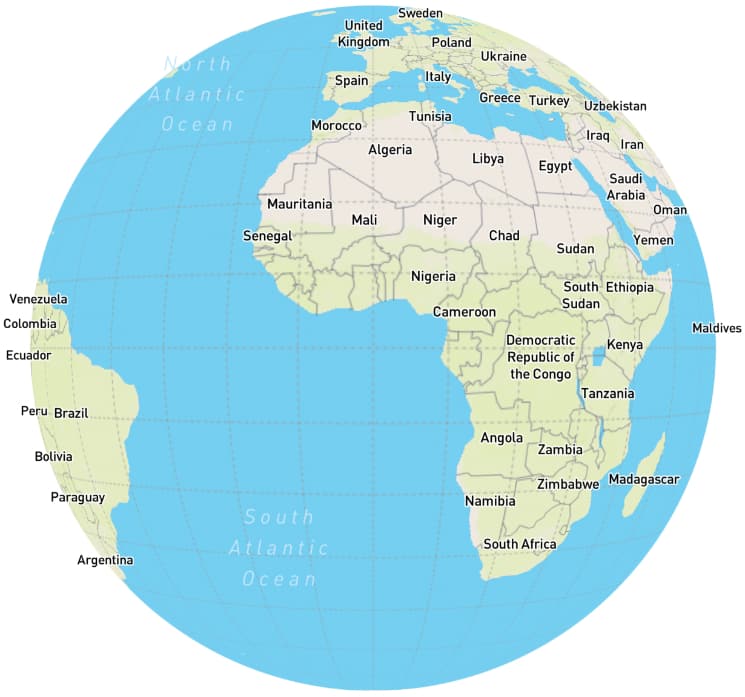
Mapbox GL JS’ latest release (v2.9.0) adds a new globe projection, which enables presenting web maps in a way that allows viewers to interact with geographic data much like you would interact with a physical globe.
This new projection displays the map as a 3d globe and can be enabled by either passing projection: globe to the map constructor or by calling map.setProjection('globe'). All layers are supported by globe except for Custom Layers and Sky.
The globe projection is a continuation from custom projections, which were introduced a couple of months ago and, for the first time, allowed creating interactive web maps using projections other than Web Mercator. While custom projections were ideal to present data restricted to countries or continents and without the hefty distortions that come with Web Mercator, the globe projection allows to do the same but on a global scale; ideal to present global data sets like visualisations of climate change.