Mapbox GL JS 2.9.0 Adds Globe Projection
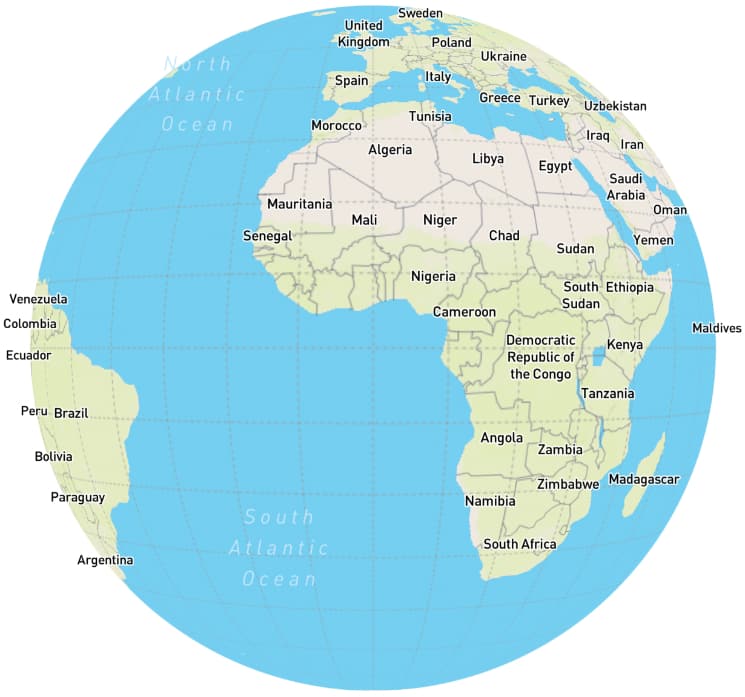
Mapbox GL JS’ latest release (v2.9.0) adds a new globe projection, which enables presenting web maps in a way that allows viewers to interact with geographic data much like you would interact with a physical globe.
From the release notes:
This new projection displays the map as a 3d globe and can be enabled by either passing
projection: globeto the map constructor or by callingmap.setProjection('globe'). All layers are supported by globe except for Custom Layers and Sky.
The globe projection is a continuation from custom projections, which were introduced a couple of months ago and, for the first time, allowed creating interactive web maps using projections other than Web Mercator. While custom projections were ideal to present data restricted to countries or continents and without the hefty distortions that come with Web Mercator, the globe projection allows to do the same but on a global scale; ideal to present global data sets like visualisations of climate change.
Update: Mapbox has published a blog post with very nice-looking examples: A new way to experience the world.