Ohsome Adds New Filters Feature for Detailed Analysis of OpenStreetMap's History
Ohsome Dashboard, part of a suite of products for exploring OpenStreetMap’s history built at Heidelberg Institute for Geoinformation Technology (HeiGIT), added a handy new feature last week:
We have a new advanced filter feature available in ohsome dashboard. Now you can globally analyze arbitrary combinations of tags and geometry types over the history of OSM.
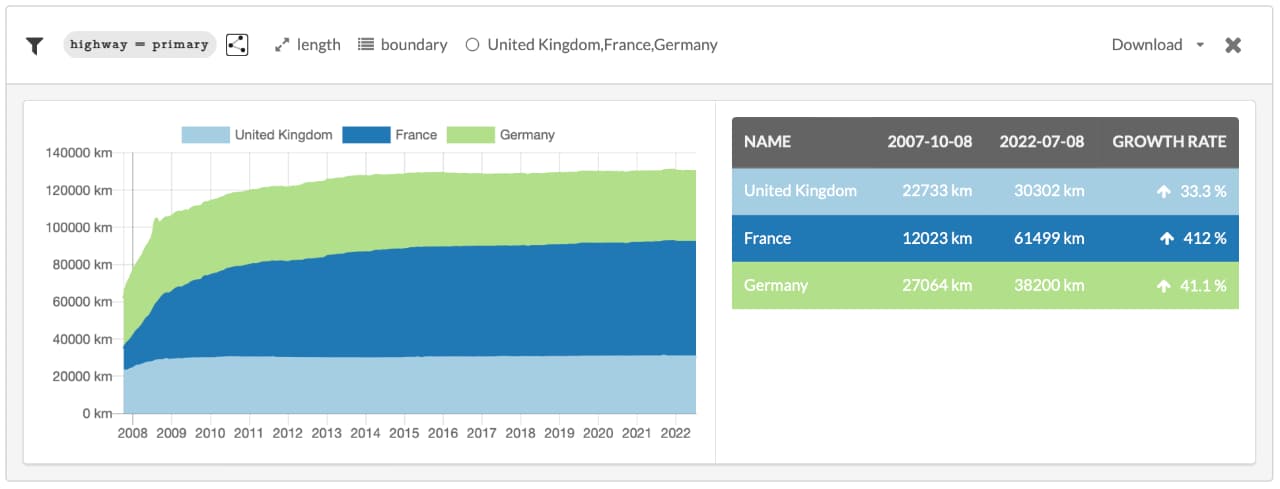
The Ohsome Dashboard lets you explore the history of OpenStreetMap by looking at arbitrary combinations of tags, OSM object types, periods of time, and areas of interest. Using a more practical description, you see how the length of all ways tagged with highway=primary has developed over the last five years and compare those numbers between Germany, France, and the UK.
Amazingly, these results can be produced on the fly. Sure it takes a minute or two to compute, but we’re dealing with vast amounts of data here. The data-exploration products from HeiGIT and the GIScience group at Heidelberg University have come a long way in the last ten years. OSMatrix, which we first released in 2012, was nice to look at, but it wasn’t nearly as helpful in exploring OpenStreetMap’s vast dataset. All of OSMatrix’s data was precomputed into hexagonal bins, and comparisons were only possible for a tiny area.