places.pub is an early-stage, experimental API that provides place objects compatible with ActivityPub protocols to enrich posts with location information or announce geosocial activities such as “arrived” (in other words, checking in), leaving, or travelling between places.
One important need for geosocial software is that all objects in ActivityPub, including Place objects, need to have a permanent URL as their id property, which shares the description of that object in Activity Streams 2.0 format. However, there isn’t a good dataset of geographical objects — countries, states or provinces or regions, cities, buildings, businesses, parks, streets — available in AS2 on the Web right now. That is slowing down experimentation in the Geosocial Task Force.
The API serves two functions: it enables social-networking applications to find locations and access places via unique URLs. It’s a surprisingly small application that runs on OpenStreetMap data hosted on Google Cloud Public Datasets.
Instead of sloshing the huge OSM dataset back and forth, I used the version of the data stored in the Google Cloud Public Datasets system on BigQuery. This let me ignore the effort of moving data, and just focus on giving it a good ActivityPub-compatible interface using a Google Cloud Run function.
So, who’s going to build an ActivityPub-compatible Swarm clone?
I’d love to see a similar interface for generating GDAL commands; Cameron Kruse:
Tippecanoe has great documentation in its ReadMe with all the info you need to get started, but I’ve often found that half the battle is finding the commands, deciding which ones to use and stringing them together into a coherent command you can actually run in your terminal. I’ve made this a little easier by taking many of the Tippecanoe features and converting them into an interface you can use to generate your commands. The premise of this tool is you select all the options you want from the dashboard and a command is generated below you can copy and paste in your terminal.
The good folks at Heigit have released ohsome-planet, a handy tool to turn OpenStreetMap history data from PBF into GeoParquet files, ready to use in common GIS applications.
Working with raw OSM data presents several challenges due to its complex structure. Typically, users require data that is readily compatible with Geographic Information System (GIS) applications. Our new tool streamlines this process, providing a structured and GIS-ready dataset for improved usability.
The tool also enriches OSM element data by integrating information from OSM changesets and administrative boundaries. This additional contextual data allows for more efficient and straightforward spatial analysis, further improving the utility of OSM datasets.
The tool is written in Java and you have to build it yourself; a small price to pay for more easily accessible free and open data.
I tried to estimate the cost of hosting Protomaps on AWS before; now there’s a handy tool for that. Based on monthly tile requests you can compare the cost of hosting Protomaps on AWS or Cloudflare with the cost of using maps from Google or hosted map-tile providers.
A comprehensive overview of libraries, command-line and web tools, frameworks, and data providers that have already adopted the recently released GeoParquet 1.0 standard.
DuckDB is a database management system for data analytics that has picked up steam in the recent months within the geospatial data community.
Chris Holmes documents his experiences with DuckDB and explores its potential for work with geospatial data:
I’m not the type who’s constantly jumping to new technologies and generally didn’t think that anything about a database could really impress me. But DuckDB somehow has become one of the pieces of technology – I gush about it to anyone who could possibly benefit.
There’s a lot to love about DuckDB: Its performance, its early support support for geospatial queries and data formats (although not fully mature), and smart extensions to SQL.
What sets it apart is DuckDB’s support for cloud-native operations via the httpfs extension and Parquet:
DuckDB also has the ability to work in a completely Cloud-Native Geospatial manner – you can treat remote files just like they’re on disk, and DuckDB will use range requests to optimize querying them.
In geospatial, we’re often dealing large data sets that are har to store and explore with traditional tools, unless you import the data into a database. But it’s not just going to make data access and processing easier on your computer. There’s also a great potential to move more large-data processing into the browser:
It’s not just that DuckDB is a great command-line and Python tool, but there’s also a brewing revolution with WASM, to run more and more powerful applications in the browser. DuckDB is easily run as WASM, so you can imagine a new class of analytic geospatial applications that are entirely in the browser.
Gregor MacLennan with a nice overview of the current state of Mapeo and what we can expect from future releases.
We developed Mapeo over 8 years through a co-design process with local partners, and have learned a huge amount about the challenges and opportunities of peer-to-peer technology along the way. This post shares some technical details about these challenges and how the solutions are guiding our work on “Mapeo Next”.
I’ve always admired the work of Digital Democracy, especially on Mapeo. They’ve built a great product for collaborative and participatory mapping, something we didn’t quite pull off when I worked at ExCiteS and Cadasta.
Where can you get within 40 minutes from every subway station in New York? Chris Whong’s fun, interactive map shows you, using GTFS data from New York’s Metropolitan Transportation Authority and Turf.js to calculate the isochrones.
This year, OpenStreetMap US stepped forward to become a steward of Field Papers for the community going forward. The transition makes sense; not only is the tool used extensively by the mapping community globally and in the US, it is also used a great deal by educators through OpenStreetMap US’s TeachOSM program and other education initiatives
While it will now be under the umbrella of OpenStreetMap US, Field Papers will be maintained as a global tool available for mappers around the world. In the next year, OpenStreetMap US will be working to develop a plan for maintenance and development that pulls in the knowledge and skills of the volunteer community, as well as expanding the financial resources available to the project.
So far, Placemark, a bootstrapped one-person project, was only available for paying customers. Now Tom released a free tier, Placemark Play, which provides the same user interface and similar features as the paid tier. The main difference to the paid tier is that Placemark won’t save your data; once your browser session ends, your data is gone.
Without data storage, Placemark Play can be compared to Geojson.io, which handles data persistence similarly, although Geojson.io offers to restore data from the last session. Placemark, however, provides a slicker user interface and more advanced geometry operations (buffers, simplification, convex hulls), imports and exports from and to various geospatial data formats, and design and export map styles for MapboxGL and Leaflet.
Placemark Play is a great option for quick data visualisation and advanced editing, when you need a little more capabilities than Geojson.io.
Mapstack, launched this week, aims to become a central catalogue for open data, a place where you discover and access datasets to fulfil your geo-data needs:
mapstack will do for open map data what GitHub did for open source, by bringing all of the world’s open maps together in one place and making them easy to discover, easy to access and easy to use.
Most of Mapstack’s functionality is currently centred around creating datasets and providing appropriate descriptions for the data. Setting up a new map involves several steps, including creating a new workspace or team, adding members, and providing a description.
Then you proceed to create the actual dataset. Upload your data, currently limited to GeoJSON and files smaller than 50MB. Then select the fields to keep and provide human-readable names. A downside is that you can’t skip this step. You have to go through each chosen field and individually confirm the label. To finalise, provide more information about the nature of the data, its geographic area, and the feature type, which creates an editable name for your new dataset.
That’s a lot of steps before you can view your dataset for the first time. Much of the information can be done after the project is set up. With the goal of discoverability in mind, however, and considering how badly many datasets are missing meta-data, you could say it’s smart design to force users to provide context.
Once the map is created, the features are limited: You can browse the data, view the attribute of features, and apply filters. There’s an attribute table, which is only available for filtered results, but not for the unfiltered data. Mapstack focuses on hosting data and making the data discoverable rather than on interacting, editing or visualising data.
As such, Mapstack is not a competitor of Felt or Placemark, two products released last year that aim to modernise how we do GIS on the Web. Mapstack complements both, and GIS tooling in general, by providing the data for the tools.
Will it take off? I’m not sure. The marketing copy draws comparisons to GitHub, but there are differences. GitHub became successful because it built on a protocol that developers already used and provided a product for collaboration around the protocol. GitHub added value to the developer’s daily work, so a lot of code ended up on the platform.
Mapstack doesn’t tie in with existing tools. Currently, there is no tooling to create or manage data, collaborate or visualise the data. It’s a place where the result of data processing might be hosted. Open data providers have invested in the infrastructure to host data—it’ll be hard to convince them to migrate to Mapstack instead.
Seek-Optimized ZIP, a new profile for ZIP files, allows random access and selective decompression. With standard ZIP files, you have to download and decompress the ZIP file before accessing its content. While fully compatible with standard ZIP tools, with SOZip, you can now selectively access files within a ZIP, so you won’t have to download the full archive if you want to access just one file.
Currently, there are two implementations for SOZip: It’s available in the development branch GDAL and as a Python module. MapServer (on the development branch) and QGIS, both applications depending on GDAL, support SOZip too.
Seek-Optimized ZIP file adds to a growing suite of cloud-native data formats and APIs, such as COGs, Zarr or GeoParquet, allowing developers and applications to access and process large selectively without the need to download complete datasets.
gpq is a nice little tool created by Tim Schaub to validate GeoParquet data and convert GeoJSON to GeoParquet. gpq also powers a web service, so you can convert GeoJSON in the browser.
Workflows, a new workflow builder introduced by Carto, allows people to build geo-data-processing workflows without writing code. It simplifies the creation of nested SQL queries. It provides means to import data from an external service or send the processing result via email.
The full extent of capabilities is pretty sparse at the moment. Workflows is currently in private beta; the public beta will be released in the “coming weeks.”
Christopher Beddow reported it first (at least in my timeline); the small-scale GeoJSON editor Geojson.io received an update after development had lied dormant for a while.
There are no recent releases, the changelog hasn’t been updated in over four years, and the Mapbox blog is quiet on the topic. It’s hard to precisely summarise what has changed. But based on my memory of the feature set before the update, newly added features include the following:
Project the data using Mapbox’s recently released globe projection.
New base maps, including Outdoors, Light, and Dark styles.
Load XYZ tile layers from external sources.
Create a set of points, ideal if you want to quickly create an artificial dataset for testing.
Enhance existing geometries by automatically adding bounding boxes to each feature.
Import data from text and binary formats, including:
Encoded polylines
Well-know Binary (WKB)
Well-known Text (WKT)
Update: Chris Whong pointed out on Twitter that most of the functionality outlined above was already existing prior to last week’s update. Chris has also updated the changelog. I missed a couple of new features, including:
The underlying mapping library was upgraded to MapboxGL, which enables the globe projection.
Automatic formatting of GeoJSON when pasted.
Code-folding, ideal for working with long GeoJSON documents.
Martijn van Exel wrote a review of Every Door, the OpenStreetMap editor for mobile phones:
We had a lot of fun mapping with Every Door, and I think we were more productive adding and updating POIs than we could have been with any other app! There’s lots of little things that make your life easier.
[…]
I would encourage anyone who likes to get out and survey to try it!! Huge thanks to Ilya for making Every Door available to the community.
I have reported on Every Door before; you should read Martin’s review for an opinion from someone who edits OpenStreetMap much more than I do.
QField, is an open-source app for collecting and managing geographic data in the field that integrates tightly with QGIS, the poster child of open-source desktop GIS. Until recently, the app was only available for Android phones, but since the release 2.4 you can also use it on iPhone devices.
We all love a bit of retro flair on our maps, don’t we? If you agree, then BellTopo Sans might be what you’re looking for. Designed by Sarah Bell, it’s a sans-serif typeface for map labels, inspired by old USGS maps:
When you see this typeface that I’m referring to on these old beautiful maps, you may think it is nothing special. It’s simple. It might even be very similar to a common font that you already know. Perhaps you’re thinking, “Why didn’t she use that font?” But for me, the beauty of this typeface that I see on old USGS maps exists within its subtle differences.
I like BellTopo Sans because, unlike many modern fonts, it is a little rough around the edges — it has character. Look at that upper-case R and that lower-case g; just look at them.
BellTopo Sans works best in medium font sizes and with a bit of character spacing.
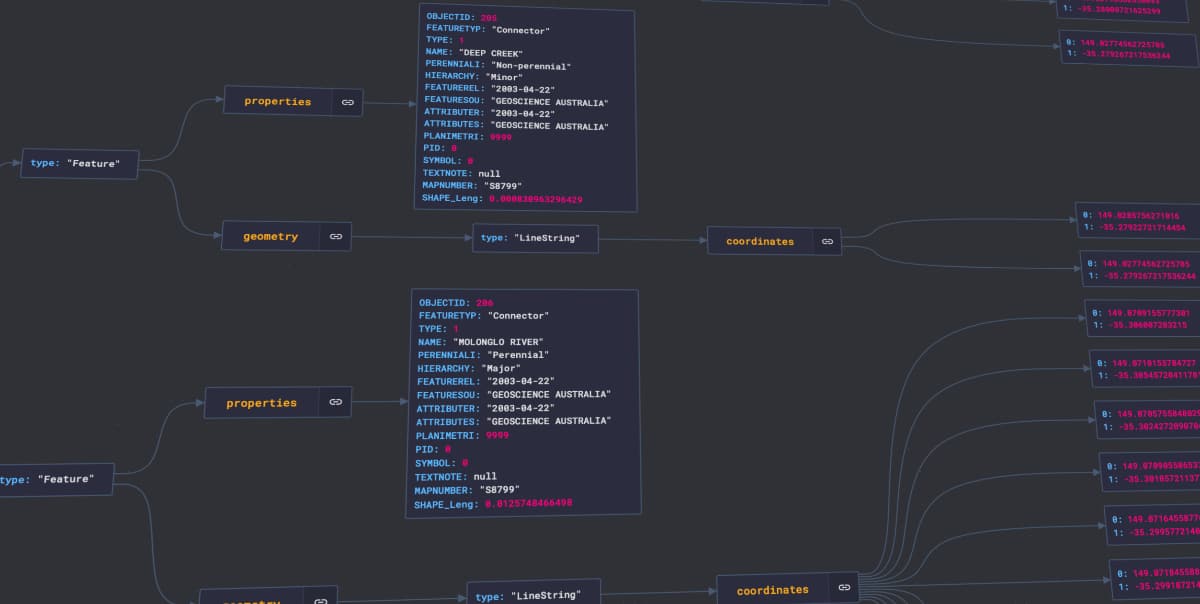
JSON documents can be challenging to read, especially GeoJSON, with complex geometries and many feature properties. JSONCrack visualises JSON documents in a graph, making them easier to parse visually and to understand their structure and content.
GeoJSON features visualised in a graph using JSONCrack.
JSONCrack works best with small(ish) files. I initially tested with a 17.7MB GeoJSON file that contains about 16,000 records. While it parses and formats the file without issues, it can’t produce the visualisation. Only at about 500 records did JSONCrack render the visual representation.
Instead of using an established navigation service and handing over details about where you’re going, how about running the infrastructure required for routing and navigation on a server you control so you know where your location data is going.
That’s the idea behind Headway, a batteries-included software stack including a front-end application, basemap, geocoder and routing engine. With just a few commands, You can spin up a Headway instance on your local machine within minutes. You can build Headway using data from over 200 preconfigured metropolitan areas, a custom OpenStreetMap extract, or the whole planet.
Headway bundles many well-known open-source software, such as MapLibre for its map client, Pelias for geocoding, Valhalla for routing, Planetiler to prepare vector tiles from OpenStreetMap, and many more.
For most people, even the nerdy folks out there, running and maintaining a personal Headway instance for your navigation needs is still likely too much effort and cost. But for anyone trying to build a business that needs navigation, Headway is a fantastic starting point to make a product.
What3Words isn’t fit for purpose, not for any purpose, really. The more people realise this, the better, especially the ones outside the usual geo crowd.
I only occasionally contribute to OpenStreetMap, mainly from the comfort of my desk and rarely on the go. I almost exclusively add and edit Points of Interest when I’m out. I used Go Map!! before, but it didn’t stick. In dense areas like central London, too many features are displayed in the editor. You see points for traffic lights, intersections, crossings, bins, and shops – all at once. Understanding what features exist or need to be added often requires clicking individual points to identify what they are.
Every Door is a new mobile OpenStreetMap editor, built by Ilja Zverev and available for iOS and Android. And it takes a different approach to edit OSM on a mobile phone.
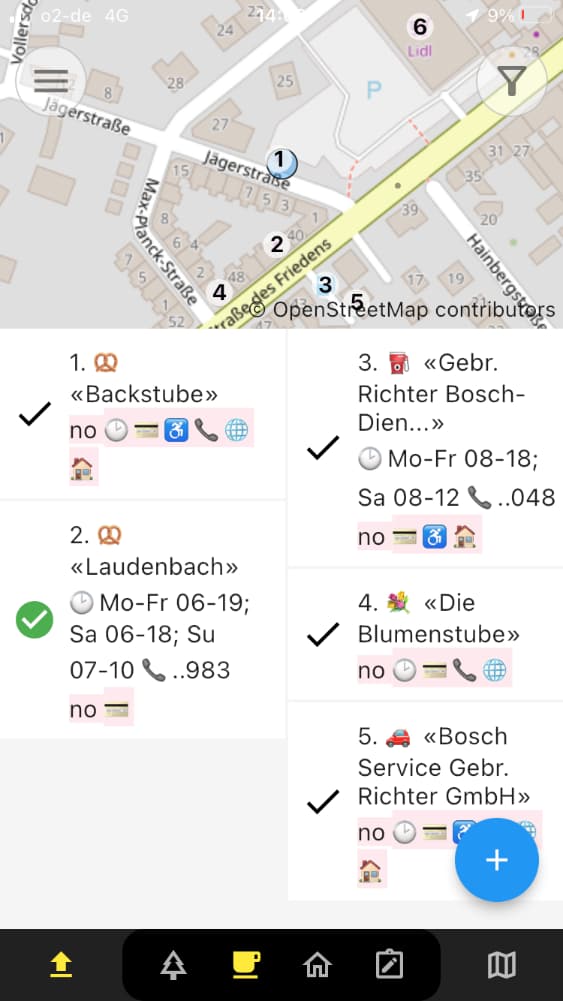
Every Door focuses on fewer things at a time. You edit amenities, street furniture or building entrances and house numbers — but never all at the same time. You pick one group, see what’s already mapped around you and can only edit and add the same feature types. And instead of showing you all of the existing features in the current map view, it downloads just a few closest to your current location. Every Door nicely caters to the way many mappers edit OpenStreetMap. They focus on one goal at a time, say to map all the rubbish bins in a park, and then just work on that until they’re done. And they map the objects closest in proximity.
Every Door shows only a small number of OpenStreetMap data in close proximity available for editing.
A few well-designed features make editing points of interest a breeze. Entering opening hours is a pain in iD, but it’s straightforward in Every Door thanks to a neat interface to select days and times, which doesn’t require composing a long string, hoping it matches the pattern OSM expects. Every Door also caches selected tags for feature types so I can quickly whizz through a park and map all benches that look the same and share the same attributes. All it takes is a brief stop next to one to get a decent GPS signal.
The interface could be more polished, and some interactions aren’t intuitive. But Every Door is a cross-OS app built by one person, presumably in their spare time. I won’t expect this to look like a boutique iOS app that costs 75$ a year. Every Door is a nice app, which takes away much of the complexity of editing OpenStreetMap on the go.
Chartographer [is] a visualization tool that breaks down different stylesheet properties by layer and zoom level for easy analysis and debugging. Now instead of panning and zooming around the map to find and identify issues, or scrolling through thousands of lines of JSON looking for mismatched zoom numbers, you can visualize how layers are styled at all zoom levels in a single view.
Chartographer looks like a handy tool if you’re hand-crafting map stylesheets.
We have a new advanced filter feature available in ohsome dashboard. Now you can globally analyze arbitrary combinations of tags and geometry types over the history of OSM.
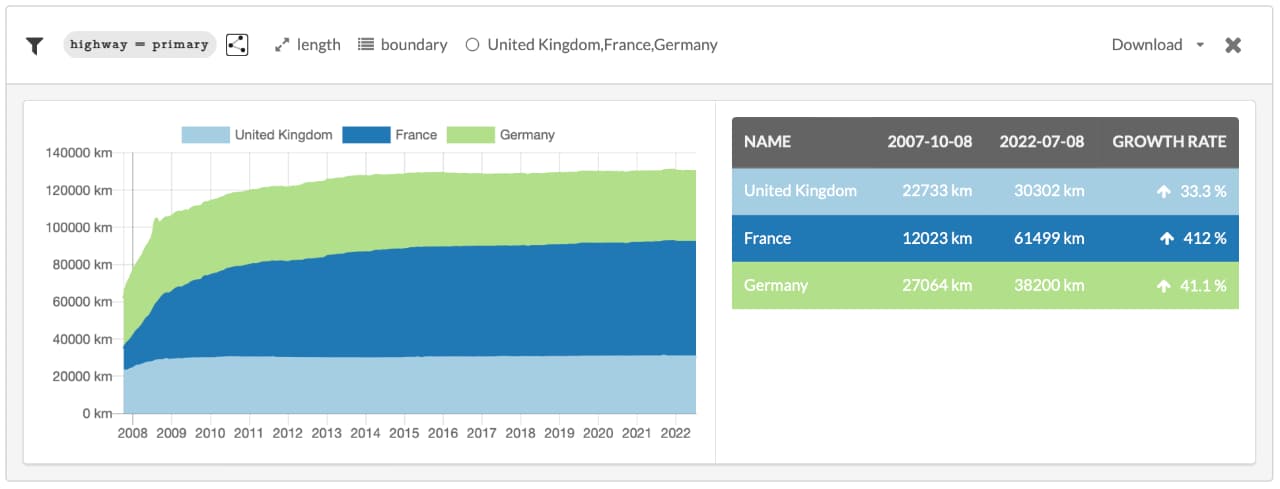
The Ohsome Dashboard lets you explore the history of OpenStreetMap by looking at arbitrary combinations of tags, OSM object types, periods of time, and areas of interest. Using a more practical description, you see how the length of all ways tagged with highway=primary has developed over the last five years and compare those numbers between Germany, France, and the UK.
Ohsome showing changes of length of primary highways on OpenStreetMap in Germany, France, and the UK.
Amazingly, these results can be produced on the fly. Sure it takes a minute or two to compute, but we’re dealing with vast amounts of data here. The data-exploration products from HeiGIT and the GIScience group at Heidelberg University have come a long way in the last ten years. OSMatrix, which we first released in 2012, was nice to look at, but it wasn’t nearly as helpful in exploring OpenStreetMap’s vast dataset. All of OSMatrix’s data was precomputed into hexagonal bins, and comparisons were only possible for a tiny area.
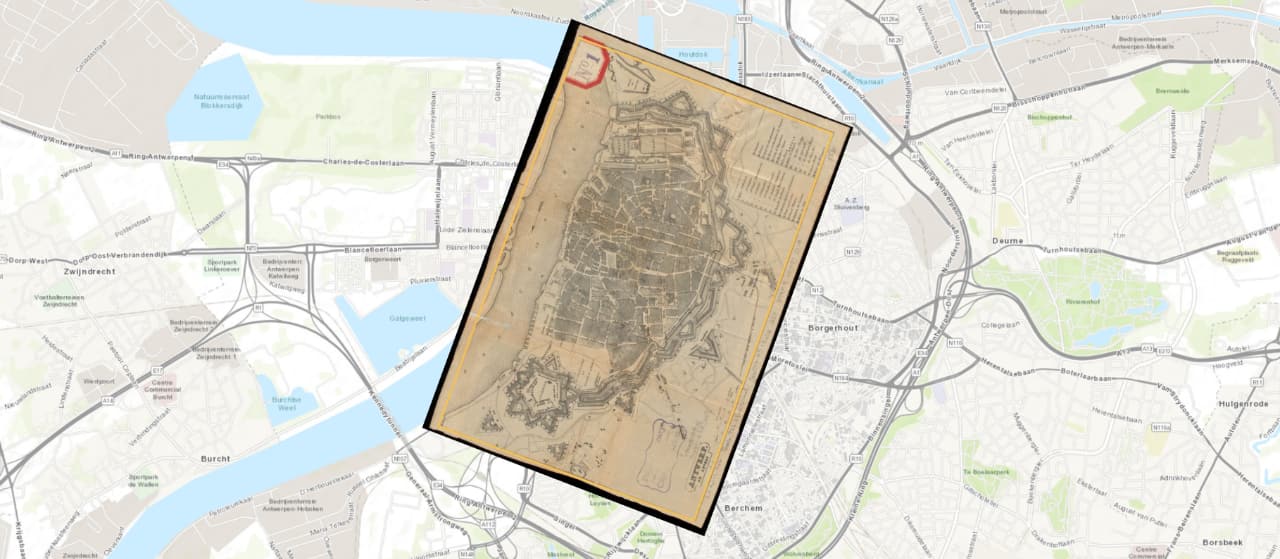
Now here’s a very cool project: Allmaps, a browser application made by Bert Spaan and Jules Schoonman, lets you geo-reference images from public sources such as libraries and public archives. You provide the URL of an image and set the reference points via the Allmaps interface. Ideal for laying digitised images of old maps over modern-day data and understanding how the geography has changed.
A map from 1860s Antwerp from the Boston Public Library layed over a modern-day digital map.
Screenshot from Allmaps.org
What is unique about Allmaps are the technical underpinnings of the application; relying heavily on open standards to access images and store annotations:
Image resources are accessed via International Image Interoperability Framework’s (IIIF) Image API, which doesn’t just return an image; it allows developers to specify region, size, rotation, and format of the returned image — ideal to crop, resize and rotate an image into place on a map.
The map’s control points are stored using a format based on W3C’s Web Annotation Data Model. The custom format uses GeoJSON to represent geographic coordinates of control points while placing the corresponding pixel coordinates inside the properties object.
Allmaps combines existing standards in a novel way, designing for interoperability from the start and enabling sharing of geo-referencing data with other applications.
Some early-internet household names are still going. Amongst them is a familiar face I didn’t think still existed: MapQuest, still used by a surprising amount of people today:
More than 17 million Americans regularly use MapQuest, one of the first digital mapping websites that was long ago overtaken by Google and Apple, according to data from the research firm Comscore.
What reminded me of MapQuest the other day: The Azure-Maps tiles that GitHub now uses to display GeoJSON files. Add a button on each side of the map to navigate towards north, east, south or west, and it will look like a MapQuest map from 2002.
Not surprising at all. The impact of the change is marginal, maps aren’t exactly a core feature of GitHub.
As part of the transition, custom icons and formatting of features in geojson and topojson files will no longer be supported.
Not just icons and formatting, it seems GitHub chose the nuclear option. There are lines and polygons alongside points in this dataset, but only points are visible on the map. Plus, it doesn’t show anything in Safari.
Is it latitude, longitude or longitude, latitude? Everybody has an opinion, no one knows. It doesn’t matter — as long as you know what the application or library you’re working with requires.
FlipCoords flips coordinates in the appropriate order and provides the result copy-paste ready in various formats, such as arrays, tuples, URL parameters or JSON objects. Very handy if you ever need to hard-code coordinates.
Felt, a new web-based map editor, launched in public beta last week.
Felt isn’t just another web GIS; it’s a tool for collaborative map-making. You can drop pins (even using emojis as markers), plot routes and highlight areas on the map and can annotate all this with text, notes and images. But there aren’t any features typical for professional GIS software, such as editing attribute tables or capturing complex geometries and valid topologies. However, Felt supports importing data from various formats (KML, KMZ, GPX, and GeoJSON) and exporting maps to GeoJSON.
This is a tool for anyone to create maps, whether they have prior knowledge in GIS or not. It’s designed for citizen engagement and participatory mapping; it’s for communities, not professional surveyors. Quite similar to the work around participatory mapping that groups like UCL’s ExCiteS and Mapping for Change do.
I like the simplicity of Felt. It focuses on a well-defined use case and is well executed. Much thought went into Felt’s design; the routing tool is a great example. Wherever you click, it snaps to the closest road and automatically calculates the route between two points, so you don’t have to add nodes to follow bends or turns at every intersection. By holding the Shift key while drawing, you can also draw segments that don’t align with the road network.
The team behind Felt found a gap in the current product landscape and is addressing the need nicely. I’m curious where they will take the $15M Series A funding.
Placemark have released a neat map-data conversation tool that transforms data between pretty much any geo-data file format. Upload files or paste text, convert and then download the converted data in no time.
In the course of implementing lots and lots of file formats in Placemark, we’ve ended up with some great, reusable tools. I figured it’d be pretty useful to just let anyone use those things, on a convenient drag & drop (or click, or paste) page. I hope it’s useful. Happy Friday!
This list will go out of date, but right now - you can convert: