JSONCrack Visualises the Structure of JSON Documents
JSON documents can be challenging to read, especially GeoJSON, with complex geometries and many feature properties. JSONCrack visualises JSON documents in a graph, making them easier to parse visually and to understand their structure and content.
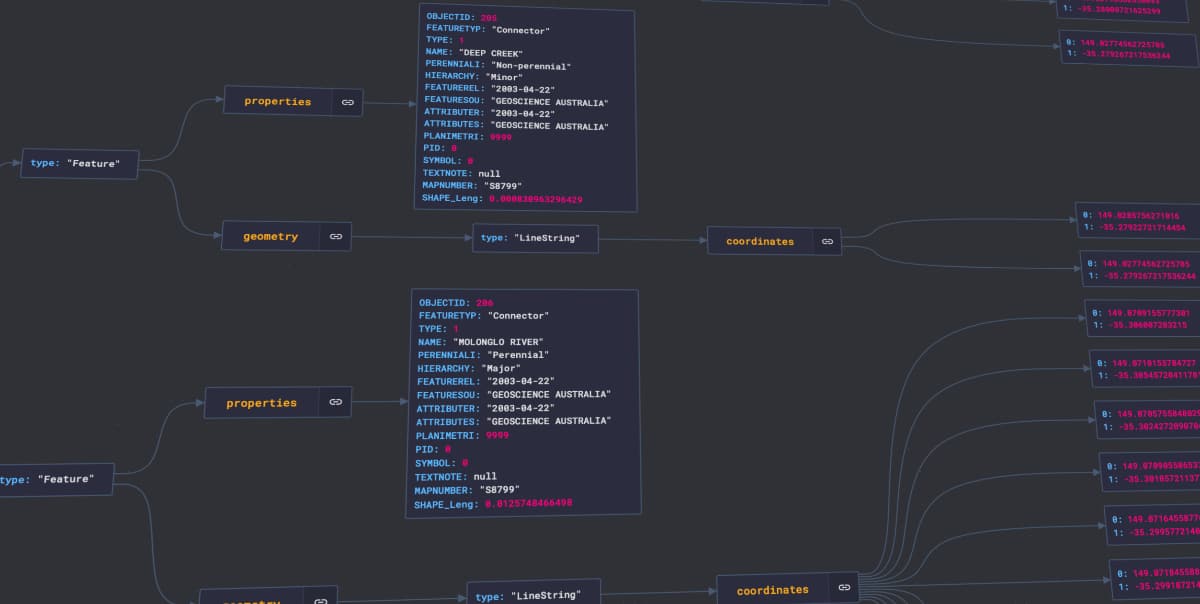
JSONCrack works best with small(ish) files. I initially tested with a 17.7MB GeoJSON file that contains about 16,000 records. While it parses and formats the file without issues, it can’t produce the visualisation. Only at about 500 records did JSONCrack render the visual representation.