FOSS4G Oceania Recordings
The recordings from FOSS4G Oceania, which took place just last week in Auckland, are already up on Youtube.
The recordings from FOSS4G Oceania, which took place just last week in Auckland, are already up on Youtube.
The global OpenStreetMap community will meet for their annual State of the Map conference in Nairobi, Kenya next year between 6 and 8 September.
We are thrilled to officially announce that the global conference of the OpenStreetMap community, State of the Map (SotM), will be making its way to Nairobi, Kenya from September 6th-8th 2024! This landmark event will bring together passionate mappers, data enthusiasts, technologists, and community members from all corners of the globe to celebrate the spirit of collaboration and open mapping.
The conference will be held in hybrid format, both online and in-person.
Python library Lonboard promises super fast visualisation of huge geospatial datasets in Jupyter notebooks. The demo renders over three million data points in under three seconds; a load that brings other libraries to their knees.
We’re sharing lonboard, a new python library, to fill this need. On a dataset with 3 million points, ipyleaflet crashed after 3.5 minutes, pydeck crashed after 2.5 minutes, but lonboard successfully rendered in 2.5 seconds.
Impressive speed, all without clustering or downscaling the data. Lonboard renderes exactly the amount of features that it finds in the data set. How is this possible you ask? Lonboard employs efficient binary data encodings, as opposed to more traditional text-based formats like GeoJSON:
Lonboard is so fast because it moves data from Python to JavaScript (in your browser) and then from JavaScript to your Graphics Processing Unit (GPU) more efficiently than ever before. Other Python libraries for interactive maps encode data as GeoJSON to copy from Python to the browser. GeoJSON is extremely slow to read and write, resulting in a very large data file that must be copied to the browser.
With lonboard, the entire pipeline is binary. In Python, GeoPandas to GeoArrow to GeoParquet avoids a text encoding like GeoJSON, resulting in a compressed binary buffer that can be efficiently copied to the browser. In JavaScript, GeoParquet to GeoArrow offers efficient decoding (in WebAssembly). Then deck.gl can interpret the raw binary buffers of the GeoArrow table directly without any parsing (thanks to @geoarrow/deck.gl-layers).
The most comprehensive reference on cloud-optimised geospatial data formats so far is brought to you by NASA IMPACT, Development Seed and the Cloud-Native Geospatial Foundation.
The guide includes detailed descriptions of increasingly popular data formats like COG, Zarr, COPC, GeoParquet, FlatGeobuf and PMTiles. It’s an essential bookmark if you deal with geospatial data on the Web in any form.
Very Spatial has compiled a collection of free and open books on spatial analysis.
I am teaching a straight forward, stand-alone Spatial Analysis class for the first time in a couple of decades. That means that I have been looking at resources to share with the class, especially reference materials that they can access given that they will mostly forget what I tell them by February once the next semester is in swing.
The call for presentations for next year’s FOSSGIS conference is now open until 6 November. Every year, FOSSGIS gathers German-speaking makers and users of geospatial open-source software and the OpenStreetMap community. The conference organisers are looking for proposals for presentations, lightning talks and workshops covering project news, use cases and research.
FOSSGIS 2024 will be hosted in Hamburg at the TUHH campus from 20 to 23 March 2024.
FlatGeobuf, GeoParquet, PMTiles, whatnot—I find it hard to understand when and how to use new cloud-native data formats. Brandon Liu has answers.
For analytics use FlatGeobuf or GeoParquet:
FlatGeobuf and GeoParquet are analysis-focused formats. They’re useful for answering queries like What is the sum of attribute A over features that overlap this polygon? But their design does not enable cloud-native visualization like COG does.
You can convert FlatGeoBuf and GeoParquet data into cloud-friendly formats using tools like Tippecanoe:
The best-in-class tool for creating vector tiles from datasets like FlatGeobuf and GeoParquet is tippecanoe, originally developed by Mapbox, but since v2.0 maintained by Felt. Tippecanoe doesn’t just slice features into tiles, it generates smart overviews for every zoom level matching a typical web mapping application. It adaptively simplifies and discards features, using many configuration options, to assemble a coherent overview of entire datasets with minimal tile size.
The output from Tippecanoe can be PMTiles a format that can be read in the browser:
The last missing piece is a cloud-friendly organization of tiles enabling efficient spatial operations. This is the focus of my PMTiles project, an open specification for COG-like pyramids of tiled data, suited to planet-scale vector mapping.
The post doesn’t go into any technical details. I enjoyed as a short and sweet overview of these new(ish) formats and how they are related.
This post by Jed Sundwall is a comprehensive look at the current state and future of Source.Coop, a repository for open data by Radiant Earth.
MapStack has similar goals, and back in May I wrote:
Mapstack doesn’t tie in with existing tools. Currently, there is no tooling to create or manage data, collaborate or visualise the data. It’s a place where the result of data processing might be hosted. Open data providers have invested in the infrastructure to host data—it’ll be hard to convince them to migrate to Mapstack instead.
I have similar thoughts about Source. These data repositories can be useful for providers of small-scale datasets who don’t want to run their own infrastructure, but I question whether we’ll see large, global datasets on these repositories. But Source already hosts several substantial datasets from big names such as NASA, ESA, or CGIAR, presumably because of well-established networks by the people involved in building Source—I have been wrong about these things before.
Currently it’s hard to understand what data is available on Source without paginating through all datasets. The platform lacks advanced search functionality that lets me look for data by geographic region, data format, or time. And to preview the data, I have to download it first and use third-party tooling. A map or table preview on the website would be far more convenient for people to explore data. (Both of these features are on the Source’s roadmap.)
A comprehensive overview of libraries, command-line and web tools, frameworks, and data providers that have already adopted the recently released GeoParquet 1.0 standard.
Geofencing business Radar introduced a new suite of APIs, aiming to get a slice of Google Map’s and Mapbox’ business:
Radar Maps Platform has it all, including base maps, geocoding APIs (forward geocoding, reverse geocoding, IP geocoding), search APIs (address autocomplete, address validation, address autocomplete), routing APIs (distance, matrix, route optimization, route matching, directions), and UI kits (address autocomplete).
Our beautiful vector base maps support classic, dark, and light themes. You can easily add base maps and UI kits to your website with v4 of the Radar JavaScript SDK.
There is nothing ground-breaking in the announcement; the features offered in the platform are the pretty standard. But Radar’s pricing is competitive, so you might as well keep this one on our radar. (Yeah, I love a rubbish pun.)
A new map style has been added to the OpenStreetMap site:
It’s a mix of osm-carto and OpenTopoMap. It has many improvements: more tag support (busway, embankment, cuisine, solar plants, aquaculture, pitch, sea, tree etc.), CJK fonts, etc. There is also better internationalisation: country specific road shields, peaks using imperial system in the US, hierarchical place rendering in China, etc.
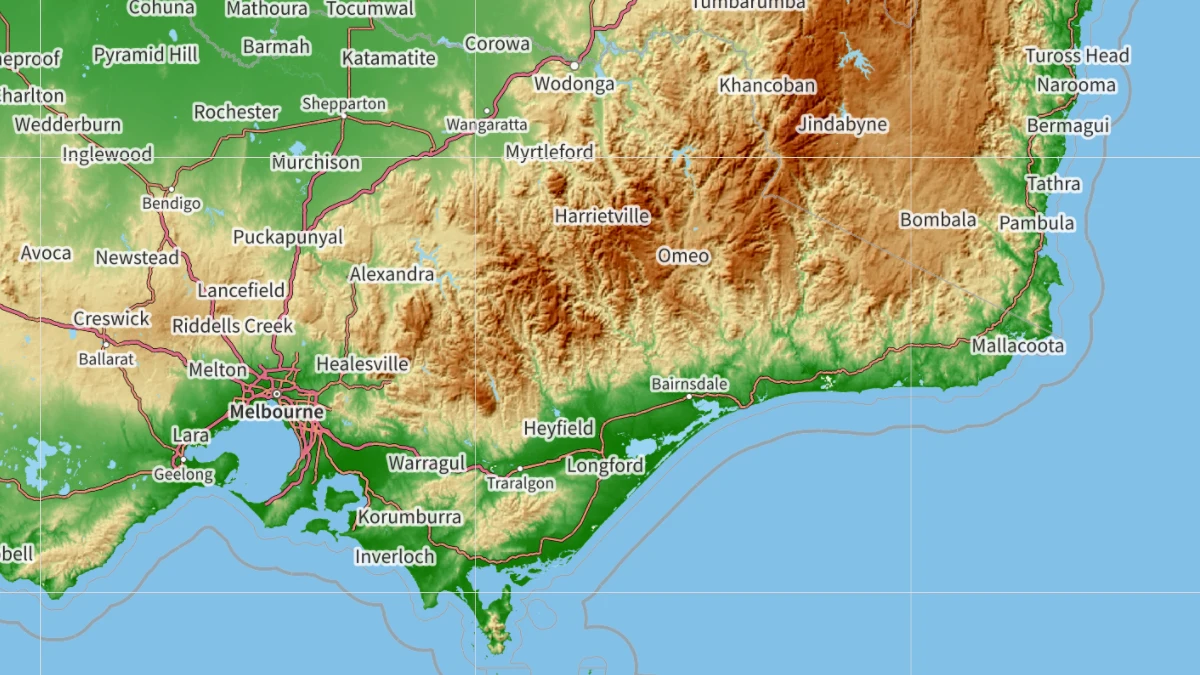
Zoomed in, it looks a lot like the standard OSM styled. In lower zoom levels, it reminds me of school atlases I grew up with. Very nice.