Consider a simple example. Flat concrete roofs are common throughout the Caribbean because they are designed to withstand hurricane-force winds. Yet AI models trained largely on North American imagery have sometimes classified these homes as parking lots because they do not resemble the residential structures the model learned to recognize. The model isn’t broken. It simply learned from a dataset where homes generally have pitched roofs, asphalt shingles, and suburban street layouts. When confronted with something different, it makes the best prediction it can based on what it knows.
The same problem appears across much of the world. A neighborhood in Lilongwe doesn’t look like a suburb in Virginia. Traditional homes in Malawi don’t resemble the structures that dominate most Western training datasets. Informal settlements in Abuja don’t follow the same patterns as planned communities in Arizona. The buildings are different. The materials are different. The settlement patterns, densities, vegetation, and infrastructure are different. When AI encounters environments it has never seen before, performance often begins to deteriorate.
Without local knowledge, you cannot produce an accurate map. This is a problem now, as it was in the days of ERDAS Imagine, when we still called it image classification rather than AI. What has changed is how we view AI output today. The marketing of leading AI companies and a litany of one-sentence-per-paragraph influencer stories on LinkedIn suggest that the models get better and better — which they do — and that they never fail; let’s go all in, trust the output and move on.
One of my first jobs was to sit in an office, stare at a screen for eight hours, draw rectangles over satellite imagery of Hungary, and classify each rectangle. We had training and extensive examples to draw from. But in the end, a team still went to Hungary to verify on the ground what we mapped. If you can’t trust a human to make correct assumptions about the state of the environment in a remote location, how can you trust the output of a statistical model when you don’t know what data it has been trained on?
I’m not arguing not to use AI at all. These tools are efficient and useful. But the model outputs include errors, and cognitive surrender is real. You need a human to control and own the output, with all its consequences. The model output is your output. If the model output is wrong, then you are.
Overture has switched the tool they use to create pmtiles from tippecanoe to planetiler. A change that yields impressive results.
Brandon Liu:
As Overture has grown, these tilesets have grown in size and take longer to generate. Prior to the April release, the tilesets for the places and divisions themes were created using the tippecanoe tool.
Tippecanoe is a powerful C++ command line utility for creating tilesets. Tippecanoe’s algorithms adaptively create low-zoom tiles by processing all features. This makes it convenient for visualizing data without configuration, but means that the large themes like Places took over one hour to generate.
From the April release onward, tilesets are created with Java code using the planetiler library. Instead of considering all features at each zoom, features are filtered to zoom levels by type. This requires more explicit feature selection, but means tilesets can be generated in a fraction of the time. […]
The Places theme tileset creation went from over 2 hours to ~5 minutes. The Divisions tileset creation went from 48 minutes to under 20 minutes.
On top of that, they changed how they manage their tile-generation infrastructure and open-sourced it. Using terraform-aws-overture-tiles, you can now create customised tile sets from Overture data and even enhance it with other data.
Overture uses data from user interactions with locations to compute a signal indicating whether a business is still operating and update its business data.
Albi Wiedersberg on the Overture Maps blog:
Instead of relying solely on user feedback or web scraping, we leverage real-world data from Overture members who regularly interact with businesses. Meta, TomTom, Tripadvisor, and Uber currently contribute the aggregated, anonymized “heartbeat” signals behind our monthly updates — and because each one sees the world differently, together they catch changes that any individual company would miss.
These signals come from securely combined, anonymized data: foot traffic at business locations, online and offline interactions, and similar activity. A pulse of activity means a business is alive and operating. Collaborating on this mechanism means we can reduce redundant efforts to keep track of this basic but highly volatile data set.
I’d love to see a more technical breakdown of how this works, what data flows in and how they compute the signal.
Meta, one of the founding members of Overture Maps Foundation, has successfully transitioned its suite of global basemaps used across apps such as Facebook and Instagram to Overture’s base data layers
The goal was to build an up-to-date, validated, global basemap using OpenStreetMap that could power all of Meta’s use cases. Daylight included validation checks designed to find and correct mapping errors, building footprint detections, lidar derived building heights, name translations, and a global land cover layer. This global dataset was made publicly available and has served the maps at Meta for the past five years.
As a founding member of Overture, Meta has been deeply involved in developing the processes that produce Overture’s published data. In fact, the very same validation processes and pipelines that were used in Daylight are also now used to produce Overture’s regular data releases.
Notice the past tense. There is no official announcement confirming Daylight’s end of life. But there hasn’t been an update since November 2024 after more than four years of at least twice-monthly releases.
Update (30 April 2025):Daylight has indeed reached its end of life. I missed the announcement in May last year, and then again, when I was looking for an official statement while writing this post, I didn’t see the update buried in between all the data updates.
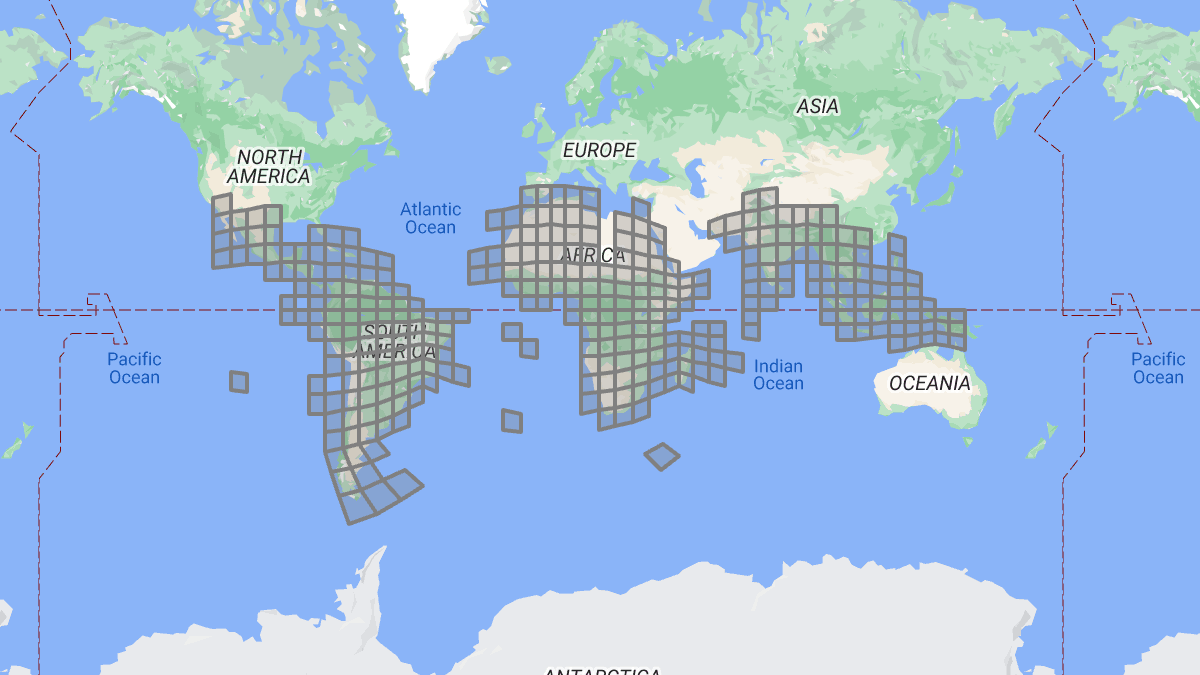
One of the important new features in this release is the introduction of Global Entity Reference System (GERS) IDs. GERS IDs have been assigned to over 1.6 million building footprints across several cities in North America, South America, and Europe.
GERS is a system of encoding map data to a shared universal reference, which provides an easy mechanism to conflate data from different data providers based on a specific GERS ID.
Overture introduced GERS recently; it aims to provide a globally unique reference for every entity that can be mapped. It appears, the idea is that data providers outside of Overture can enrich their data sets with GERS to increase interoperability and ease the effort required to fuse data. An enticing idea, sure, but it seems GERS is of little use outside of Overture’s ecosystem.
Let me explain.
In order to retrieve and enhance a data set with GERS IDs, you have to match your data to Overture’s using geometry intersections. This works, but it’s not a novel approach. We were able to do spatial joins before, and IDs also existed before. If a feature is not yet part of Overture’s data, then the only way to create a GERS ID is to add it to Overture’s data set. GERS practically doesn’t exist outside of Overture data.
And questions remain how GERS keeps up with changing data. What if I knock down my house and build a new one at the same place? Does the original GERS ID continue, or is this a new one. What if I subdivide my property; does this result in two new GERS IDs, or is the existing one applied to one part? How about I buy the property next door and connect the two house so they become one?—New GERS ID or one of the original ones? And what if the GERS ID for an entry changes? How do I keep track of these changes to update the IDs in my dataset? If we look at GERS as a gateway to keep datasets in sync, then these are crucial questions to answer.
It’s early stages and I’m sure there are discussions within Overture to address these concerns. But for now, GERS’ only application will be conflation of data from Overture data donors to produce their building datasets.
Mapstack doesn’t tie in with existing tools. Currently, there is no tooling to create or manage data, collaborate or visualise the data. It’s a place where the result of data processing might be hosted. Open data providers have invested in the infrastructure to host data—it’ll be hard to convince them to migrate to Mapstack instead.
I have similar thoughts about Source. These data repositories can be useful for providers of small-scale datasets who don’t want to run their own infrastructure, but I question whether we’ll see large, global datasets on these repositories. But Source already hosts several substantial datasets from big names such as NASA, ESA, or CGIAR, presumably because of well-established networks by the people involved in building Source—I have been wrong about these things before.
Currently it’s hard to understand what data is available on Source without paginating through all datasets. The platform lacks advanced search functionality that lets me look for data by geographic region, data format, or time. And to preview the data, I have to download it first and use third-party tooling. A map or table preview on the website would be far more convenient for people to explore data. (Both of these features are on the Source’s roadmap.)
My colleague Wille Marcel looked at Overture’s data quality, specifically considering the confidence score that is included in the data:
This analysis shows that the Overture Places dataset can be quite useful when filtered by a 0.6 confidence threshold. The main quality issues we observed are the inaccurate location of many items and outdated places.
This matches my experience with the data. In my area, the location accuracy could be better; many businesses are located outside their buildings, in the middle of the road, the backyard, some even on the beach. And the data includes some businesses that have since closed.
Ahead of Google Cloud Next 23, the company announced new map data sets available through the Google Maps API.
Now we’re expanding our sustainability offerings with new products in Google Maps Platform. These products apply AI and machine learning, along with aerial imagery and environmental data, to provide up-to-date information about solar potential, air quality and pollen levels. With this technology, developers, businesses and organizations can build tools that map and mitigate environmental impact.
The SolarAPI helps building owners and developers estimate potential energy savings by leveraging solar power. Using imagery, LIDAR data and 3D models, the data provides insights on the solar potential of a building and aids the design of solar systems. The data covers 40 countries.
While data from the Solar API can help tackle the causes of climate change, the Air Quality and Pollen APIs help humans mitigate its effects.
Based on a model that takes in land cover, climate data, pollen-production rates from various plant species, the Pollen API provides estimated pollen counts for 15 plant species in 65 countries. The Air Quality API combines data from various sources, including “government monitoring stations, sensors, models, meteorological data, satellites, land cover, and live traffic information,” to create a air-quality layer covering 100 countries.
James Killick collecting some damning anecdotes about the quality of crowdsourced data on Google Maps.
There are unregistered Taxi services listed at Heathrow airport.
Upon that I was shown a Google map of LHR Terminal 5 with an icon for “Bob’s Taxis” right there in the middle of the arrivals area. Not good.
[…]
Yes, dear readers, the dreaded unlicensed taxi cab service is still there. It’s no longer called “Bob’s Taxis” and it now sounds a lot more official, but hey — I pity the poor passengers that fall for this.
After a minute the line broke up, but they called me back… from the number +33-4-56-38-67-82 (French number that came up as DTI Publishing in Caller ID). First Red flag. He had a very strong Indian Accent (Red Flag), and was overly eager to help me
I usually try to find critical information on the business’ website instead of Google Maps; not because of scammers but because I don’t trust that businesses update their information on Google Maps.
I’ve been using Apple Maps for a while now for my personal way finding needs and I’ve had only positive experiences. So far I’ve never encountered incorrect information and the map is less littered with irrelevant data.
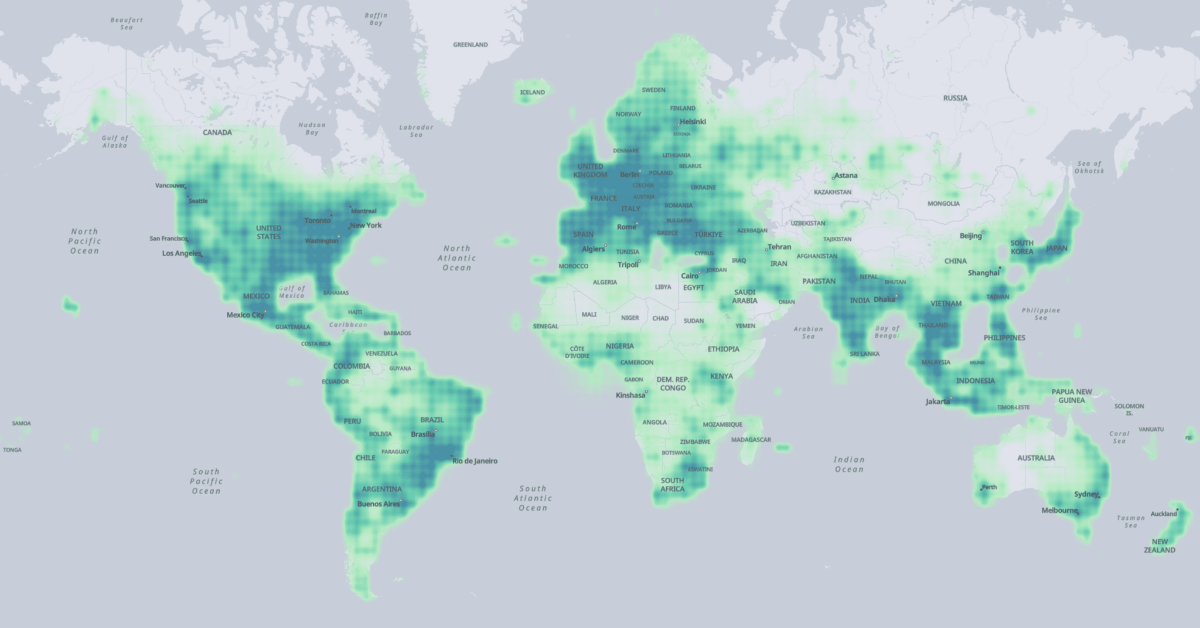
The extent of the Overture Map Foundation's places data across the globe. (Source: Overture Map Foundation)
The four layers combine data from different sources into one uniform data schema. The data has been sourced from commercial data provides, all members of the foundation, and and OpenStreetMap:
Meta contributed to places of interest,
Microsoft contributed to places of interest and buildings,
Esri contributed to buildings, and further
Buildings and transportation data was sourced from OpenStreetMap.
Accordingly the licenses vary for each data layer:
Places of interest and administrative boundaries are licensed under CDLA Permissive v2.0; the data can be modified and shared as long as the original license is included.
The buildings and transportation layers are available under ODbL, which the same as OpenStreetMap’s license.
The data is hosted on AWS S3 and Azure Blob Storage and available for download in the Parquet format, a cloud-native format. You can download the data to your local machine using the AWS CLI, Azure Storage Explorer or the AzCopy.
Alternatively, to make use of Parquet’s cloud-native capabilities to download only the data you need, you can fetch data via SQL queries in AWS Athena, Microsoft Synapse, or DuckDB.
The data release is the first major sign that the the Overture Maps Foundation is alive and produces results. Combining sources from major providers could yield one of the most complete and up-to-date data sources we currently have; it would be interesting to see how it compares to OpenStreetMap. Plus the use of modern, cloud-native formats make this vast dataset manageable, without clogging up your hard drive.
The data was created from high-resolution satellite images, using machine learning. As such, it only contains only the building geometry, data that can be derived from the building footprint (centroid, area, it the Plus code), and the level of confidence in the mapping. However, no further information about a building are available, like its height, building type, or address.
You can download the data in CSV format, one file per S2 level 4 cell, with the building polygons in WKT. Other common geospatial formats are not available and additional processing and data ingestion may be required for many use cases.
Google announced that their 3D tiles will be available through the Map Tiles API. Surprisingly, the API isn’t a proprietary design but implements the OGC 3D Tiles standard, which opens the dataset up for visualisations using open-source client libraries such as Cesium or Deck.gl.
You have to register with Google and provide an API key to use Google’s 3D Tiles. The service is free, for now, during its experimental stage.
The Geofabrik Shapefiles have been a go-to resource ever since for OpenStreetMap data in GIS-friendly formats. Geofabrik now also offers vector-tile downloads for individual countries in Europe and states in the US.
At this time, the service is experimental, with no timeline for a stable and regularly-updated product:
This is supposed to be an experiment and we don’t yet make any promises about the structure and update frequency of this offer. We’re happy to hear your ideas though.
Bunting Labs’ new API to download OSM data is looking good. I’m not an OSM power user and every time I try to use Overpass to download some data from OpenStreetMap, I’d struggle for an hour and then download one of Geofabrik’s Shapefiles instead. Overpass is extremely powerful, but its syntax is just as hard to understand—which is ok; powerful software is always complex.
The new API is less powerful but more approachable for occasional users like me. It abstracts away much of OSMs complexity, providing a simpler syntax for accessing data via HTTP requests, and it returns neat GeoJSON data.
Jochen Topf has published a the preliminary report on the shortcomings of OpenStreetMap’s data model. It’s a very very in-the-weeds document, providing an in-depth discussion of the current state of OSM’s data model and ways to improve and future-proof it.
The report vets the data model against the backdrop of anticipated growth of the OSM data set and its implications for data processing, it looks at the lack of a native polygon geometry type (a classic!), limitations related to mapping large objects or and those with fuzzy boundaries, its incompatibility with standard GIS software, and many others. Topf also suggests solutions addressing some of the problems, including removing untagged nodes, introducing an area type, limiting the length of tag values, changing the database management system, and offering different data formats via the API and for exports.
How many of the proposed changes will be implanted remains to be seen, Topf himself is cautious:
I am not proposing any action or, at most, minor steps. This is not because those are not important issues, but because I cannot see a clear path to any improvements. Often the goals are too vague to be actionable.
Implementing just some of the proposed changes would be if big lift, every tool interacting with the OSM data and API will be affected; every editor, every command-line script that coverts data, every export tool. It would require constant engagement with the community and strong technical leadership.